11th July 2019 marks 30 years of observing World Population Day and this got us thinking about how much the world has changed and is still changing.
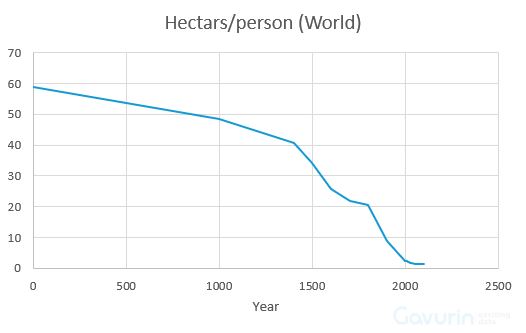
Our population is growing, that isn’t a secret, and the world only has so much space. Our planet is already feeling the pressure from its current population of around 7.6 billion and current projections indicate that we’ll have added close to 1 billion more by 2030. There are 15,000,000,000 hectares (ha) of available land for us all to live on, but how much space do we actually have? Who is using this space? Is being used fairly?
World Population Day
Using information from UN1, the Maddison Project2 and USCB3 we know that back in the 1800s, before the world hit the 1 billion mark, it could be divided up among all its human inhabitants to around 20.58ha per person. Now, we are living on c.1.92ha each and that number is shrinking.
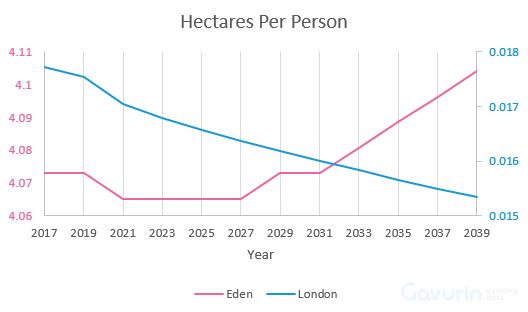
Looking at England specifically in a bit more detail, we were able to break this down by population per local authority by using data from the ONS. Interestingly, people in London can enjoy 0.018ha per person (180 sq/m) whereas if you compare this with the opposite end of the scale, people of Eden can enjoy a whopping 4.07ha (40,700 sq/m).
If we look ahead at the projections for 2037 we can see that people in London will have lost around 0.003ha (30 sq/m) per person whereas Eden residents will actually have gained 0.03ha (although, they’re probably sharing their space with a few more sheep and livestock than Londoners).
World Population Day
So who’s using this space?
The world has a growing population but also, an aging population. Compared to the life expectancy of 1800s, which was between 30-40 years of age, these days the average is between 70-80.
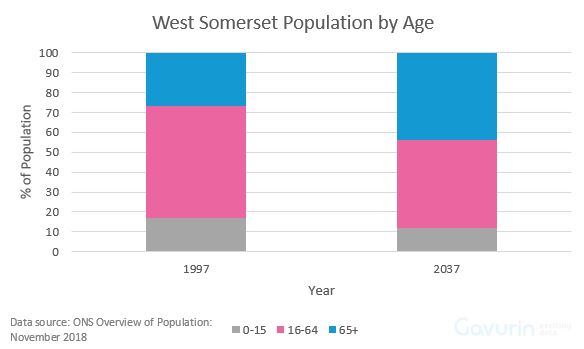
One thing we discovered in our quest to better understand the English population, was that in the coming years, some areas will have more people outside of the typical working ages (16-64) than within them.
By 2027, West Somerset will be the first place where over half of their population will be under 16 or over 65…
World Population Day
…but by 2037 it will be joined by the likes of Rother, West Dorset, East Dorset and North Norfolk to name a few.
% of Population aged between 16-64 by 2037 (Top 20)
1. West Somerset (44%)
2. Rother (46%)
3. West Dorset (46%)
On the flipside of this, are areas which will have the highest proportion of their population within the working age range by 2037 (Top 20)
1. Tower Hamlets (72%)
2. Islington (72%)
3. Lambeth (71%)
So what does all this tell us?
As our population increases, our available space decreases. The Earth isn’t getting any bigger so perhaps we need to start making better use of the space we do have available.
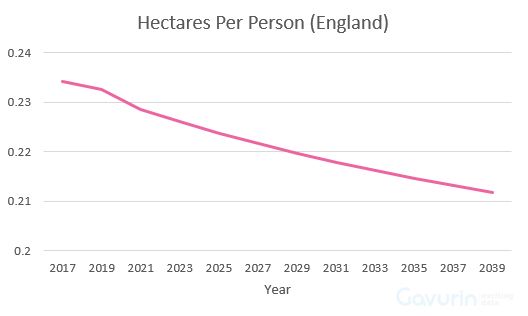
While some places (as shown above) are gaining space per person, on the whole England’s population is growing. The average space at present is 0.23ha (230 sq/m) but will drop to 0.21 by 2039. Places like Eden, while yes, they will have more space per person, they will also have an older population compared to somewhere like London which has a population majority of 16-64-year olds. Working aged people are moving towards cities putting more pressure on these areas, further exasperating the local demand for land.
World Population Day
This is just a brief overview of the population and the ever-growing pressure on the land in honour of World Population Day. What we haven’t explored in this blog is how we actually use the land and how this needs to change in order to sustain the population. But we’ll save that for another day.
1 Maddison Project Database, version 2018. Bolt, Jutta, Robert Inklaar, Herman de Jong and Jan Luiten van Zanden (2018), “Rebasing ‘Maddison’: new income comparisons and the shape of long-run economic development”, Maddison Project Working paper 10
2 Data from United Nations Department of Economic and Social Affairs, Population Division. 1950–2100 estimates (only medium variants shown): (a) World Population Prospects: The 2008 Revision. Estimates prior to 1950: (b) “The World at Six Billion”, 1999. Estimates from 1950 to 2100: (c) “Population of the entire world, yearly, 1950 – 2100”, 2013. Archived November 19, 2016, at the Wayback Machine 2014: (d) http://esa.un.org/unpd/wup/Highlights/WUP2014-Highlights.pdf “2014 World Urbanization Prospects”, 2014.] 2015: (e) http://esa.un.org/unpd/wpp/Publications/Files/Key_Findings_WPP_2015.pdf “2015 World Urbanization Prospects”, 2015.]Archived March 20, 2014, at the Wayback Machine
3 Data from U.S. Census Bureau, International Data Base Retrieved on 28 Oct, 2017
Get notified when new content is added
Join our mailing list to receive notifications when new content is published
You have Successfully Subscribed!