
Good Data is a liberator for charities
This is a short series of blogs on the Data Revolution in charities. Sadly, the phrase is close to being a cliche.
We base these blogs on three things: First, our experience of working with a small number of charities. Second, our experience of what data can and should deliver. And finally, our personal experiences as people who give. Of these three things, we know most about the general data landscape. We’ve used data as economists and business advisers across many sectors, including charities.
This blog … is about fundraising from other than individuals.
The UK Landscape for charities (and us all)
We are committed to evidence based (or data based) decision making. That seems self-evident but it needs to be said, repeatedly. We are experiencing economic turbulence at home and globally. When the words and behaviours of people grab the headlines, when numbers are thrown around willy nilly and ‘experts’ are people we’ve ‘had enough of’, we find it difficult to hang on to the notion that basing decisions on real ‘stuff’ is worthwhile. But it is.
Working with charities, we believe passionately that good data / good evidence can support four topic areas which seem to be data deprived. (See below for what we mean by ‘good data’) . These four areas are:
- the demonstration of impact to corporations, trusts, foundations and high level givers
- the forecasting & modelling of data to support strategic planning
- the analysis of campaigns
- the macro analysis of donor demography. I use the term ‘macro’ because I am not referring to individual donor profiling
In this blog, I will show how The Prince’s Trust is demonstrating impact – the first on our list of topic areas.
(I am grateful to Dermot Finch, Director of The Prince’s Trust for London & the South East for permission to use these examples).
From ‘donor’ to ‘decision maker’
Although the individual decision to give is often a profoundly emotional reaction to an event or a story, the organisation that supports a cause is likely to have made a ‘decision’ to do so. I suggest that thinking of ‘influencing decision makers’, rather than ‘fundraising from donors’ is a good way to envision this.
The nature of a ‘decision maker’
Decision making is a process of selecting from available options. A ‘good’ decision involves weighing the positive and negative outcomes associated with each option, and considering the alternatives. Truly effective decision making also involves forecasting outcome options.
When choosing to give, an organisation is often choosing charity A over charity B and alternative uses for its money. Consciously or sub-consciously, a decision maker is:
- Saying to herself that a gift will impact positively on a set of outcomes
- Forecasting that those outcomes are sustainable
- Assuming that the organisation will be tracking outcome performance and
- Ideally able to track the way that the organisation’s particular gift makes a difference
Number 4 could be a big ask but items 1 – 3 surely are not. And although I use the first person above, it is rarely a single individual in an organisation that makes a decision to give. Even for High Level Givers, it is possible that advice is sought and counsel heeded.
Demonstrating outcomes for charities
Showing that a decision to give money will have a positive outcome requires ‘good data’. We believe that is:
Data – appropriately used (standardised, comparable)
Data – excellently presented (accessibly, speedily, appealingly)
The case of The Prince’s Trust
The Prince’s Trust helps young people aged 13 to 30 get into jobs, education and training. It follows that a decision to give money to The Prince’s Trust should result in young people, helped by the Trust and previously out of work, being in work. A first step is getting young people onto a Prince’s Trust Programme. Therefore, the data below is Prince’s Trust MARKET PENETRATION data. It may appear odd to think about The Prince’s Trust having a ‘market’ but of course it does and thinking about the work of a charity in market terms is an important first step towards thinking about the best data to measure impact.
The market penetration picture – today
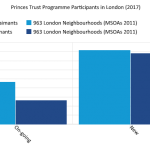
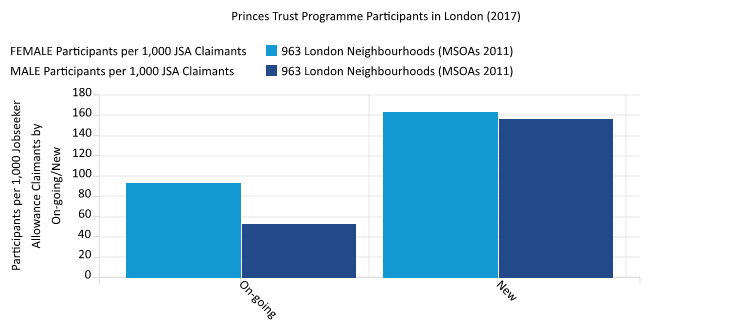
This Chart shows:
- That market penetration across London rises to a staggering 160 young people per 1,000 job seeker allowance claimants
- That today, as a proportion of jobseekers, the Trust supports slightly more women than men.
- Participants are on both new and on-going Programmes.
This chart demonstrates the first principle of ‘good data’; a chart should be standardised and comparable. The chart blends The Prince’s Trust’s own participation data with Office of National Statistics data to deliver a rate per 1,000 job seekers. If the data were not standardised a giver would be unable to compare one place with another place.
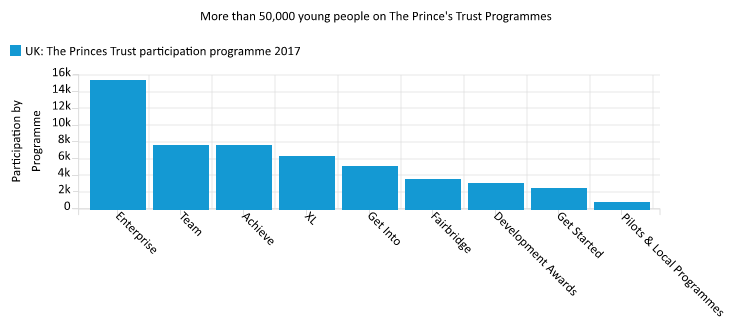 It’s also important to demonstrate the right level of detail in the data. Some people will want to give for one aspect of a charity’s activity rather than another. This chart shows that in total, more than 50,000 young people are on Programmes across the UK. However, an entrepreneur might be particularly interested in funding the Trust’s Enterprise Programme and she will want to have that particular outcome demonstrated.
Is market penetration improving or worsening?
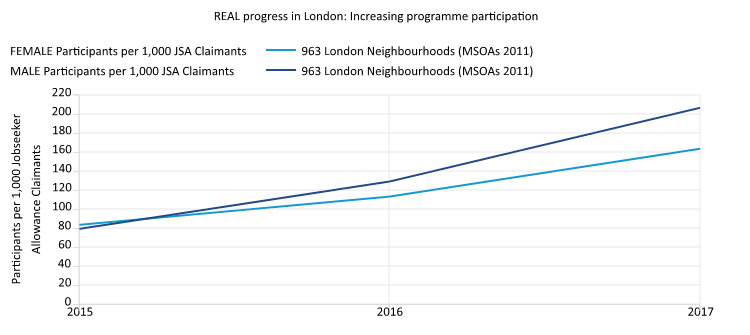 The chart shows Trust performance is significantly improving.
Therefore, a giver knows that a decision to give is having a sustainable impact.
I’d like also to suggest that charts like this one and that above should stand alone as far as possible. I haven’t commented on them too much – the story should be self evident in the picture and its title.
Is market penetration evenly spread – what’s happening in my part of town?
The map answers the question!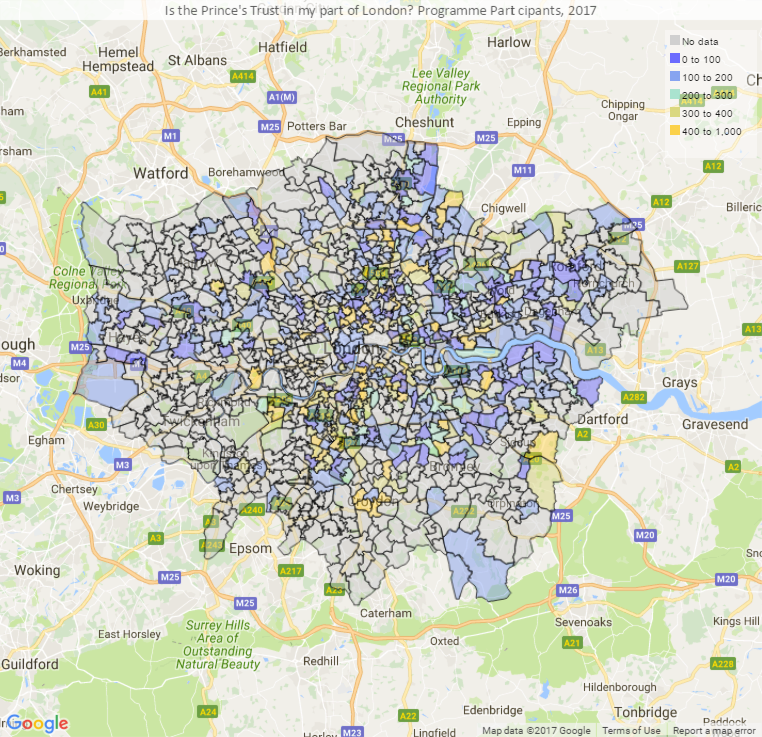
Maps are important. They are ‘visualisations’ that most people are familiar with. Charts are not. Many of us are unfamiliar with reading a chart. For a London resident, a map attracts his or her attention to a place of work or residence.
Maps also offer the opportunity to offer givers a different kind of granularity. An example of this is shown here which also highlights the opportunity data offers to influence or lobby. This map shows Trust market 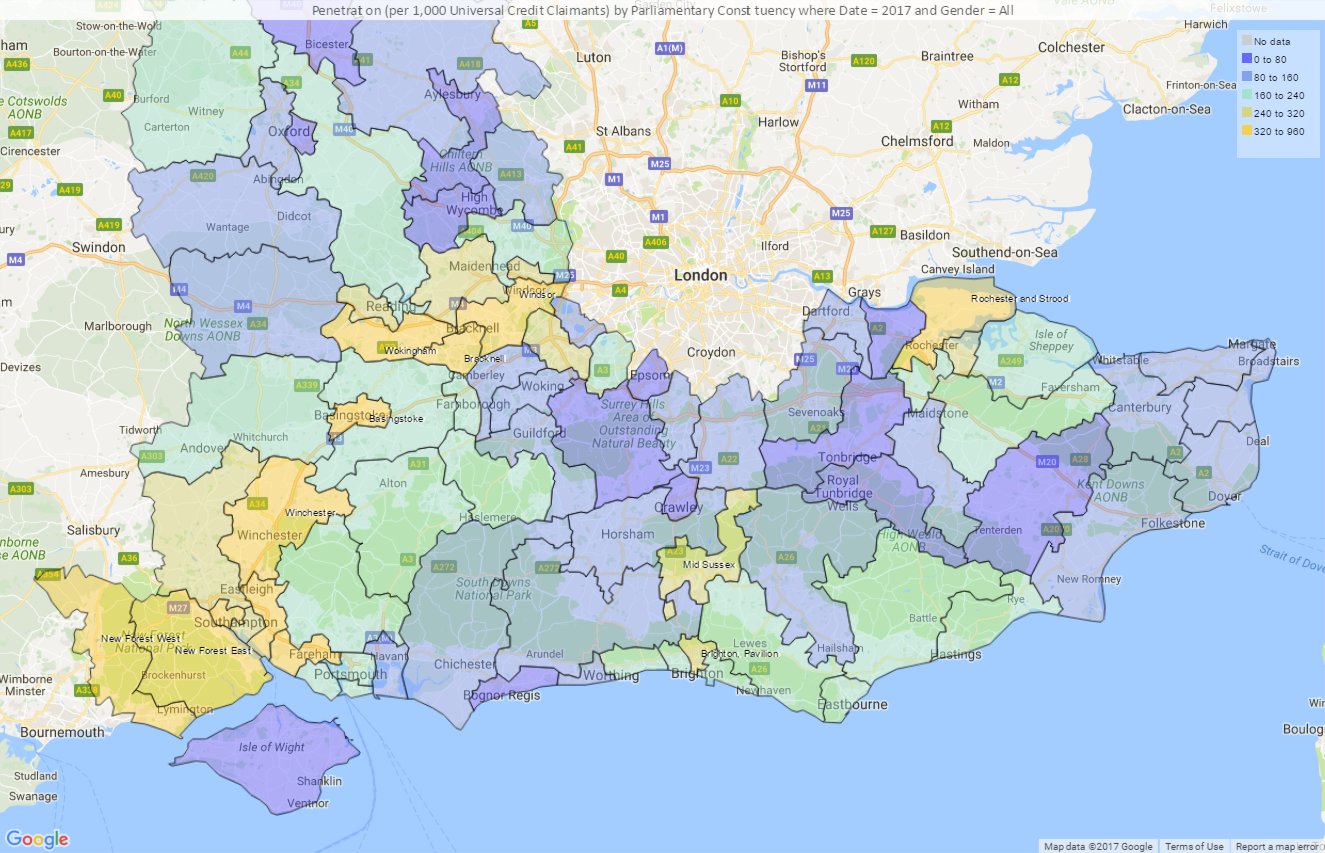 penetration (this time by Universal Credit Claimants) in Parliamentary Constituencies in the South East. Influencing MP’s or perhaps responding speedily to a Parliamentary Question or responding speedily to a constituency issue raised by individual MP can reap significant reward for charities.
Access, Speed, Look & Feel
Earlier, I defined ‘Good Data’ as data that are accessible, speedily and attractively. Offering online access to outcome data for corporations, trusts, foundations, high value givers would open up a powerful channel of communication.
However, it’s likely that there will be the need to communicate through other channels, and effective and efficient reporting is crucial. As an example of this, I’ve ‘translated’ the images above into a report, which you can see here: A Simple Sample Report. (I’m unable to comment on the data, so I’ve largely used lorem ipsum text).
Reports like this are produced, on the fly, with live data; users in The Prince’s Trust simply bring up the last report, click ‘update’ and hey presto the latest report is available – in multiple formats.
The benefits of producing a report like this, speedily and with no significant effort are clear. The features of the technology to do it are not obvious from the examples, so do please get in touch with Ian Hunt, or call Ian on 07890 323 434 (The hyperlink goes to our contact page – we avoid email addresses on our website).
In our next blog, we’ll consider the forecasting & modelling of data for charities.
Get notified when new content is added
Join our mailing list to receive notifications when new content is published
You have Successfully Subscribed!