Biotech. Once upon a time, every region claimed that it was the life science centre of the UK. I know, because I was required to adjudicate on the claims. Today, for ‘biotech’ read ‘digital’. Or perhaps just ‘tech’.
Back then, we asked whether data supported the presence of real biotech companies employing real people. And mostly, the data didn’t. Of course, everywhere had bits and bobs of biotech – but real comparative strength was largely absent outside the Oxford / Cambridge corridor.
Back then, the holy grail being pursued was a ‘cluster’ – a biotech cluster.
Jump to today. Does anywhere outside London’s Silicon Roundabout have real comparative tech strength?
Jump to today, and once again the noun after the adjective is ‘cluster’.
Do the claims of digital / tech cluster strength in Manchester, Newcastle, Bristol have any substance? Or is this hype just like the biotech one – delusional?
Well it’s not delusional and in one case, most definitely not. But like all hype, there is a degree of reality with which it must be tempered.
What’s a cluster?
A network of related and supporting industries strengthening a core industry combine to create a ‘cluster’.
How is strength measured?
Industrial strength is measured by location quotients. An LQ of 1 suggests an industry which has about the number of people in an area that you might expect. An LQ of 2 suggests an industry with twice as many. And so on.
LQ’s are fundamentally about how big a proportion of an area’s employment is specialised – concentrated in industries.
What’s an industry?
That’s a tough one. An industry is something signified by its Standard Industrial Classification. For example, UK SIC 620 is “Computer programming, consultancy and related activities”. The trouble is that SIC codes aren’t resilient. They don’t keep up with tech development and they don’t capture the nitty gritty detail of what a company does.
On the other hand, there is no reason to believe that these handicaps are any more severe in Manchester than they are in Newcastle. So comparatively, they offer real insight into those comparative strengths and weaknesses.
And the real litmus test for data, big or otherwise, is whether the results broadly ring true. As we’ll see, that is the case here, so we can rely on the detail. Admittedly, we can’t see what individual companies actually do, but for this exercise we don’t need it.
Where does the data come from?
The data are published by the Office of National Statistics (ONS). It publishes Location Quotients for Standard Industrial Classifications for all Local Authorities in the UK. There are four relevant SIC codes:
| 582 : Software publishing |
| 620 : Computer programming, consultancy and related activities |
| 631 : Data processing, hosting and related activities; web portals |
| 639 : Other information service activities |
London & the South East DO dominate, but …
The basic headline is that the data shows massive concentration in the capital and around it for all the tech industries. For “Information Service Activities”, London’s workforce is around 4 times more than we’d expect it to be. No surprises there.
| Location Quotients for tech industries | South East | London |
| 582 : Software publishing |
1.96 |
2.26 |
| 620 : Computer programming, consultancy and related activities |
1.86 |
1.71 |
| 631 : Data processing, hosting and related activities; web portals |
1.14 |
1.35 |
| 639 : Other information service activities |
0.54 |
3.6 |
But, dig a little deeper and we do get some surprises.
Newcastle / Gateshead have something to shout about
Newcastle’s LQ for Computer programming, consultancy and related activities is a whopping 1.43, only marginally lower than London’s. Across the Tyne in Gateshead it’s a similarly hefty 1.39. That’s far ahead of any other city in the UK. (Manchester is next in line at 0.9).
Newcastle / Gateshead heft doesn’t stop there. A key element of a successful cluster is the presence of specialised education & research (one of those ‘related and supporting industries’).
And here, the Newcastle / Gateshead story is made all the better by the creation at Newcastle University of a Big Data Research Centre, with a large slice of Government money alongside a Cloud Innovation Centre – also with Government money.
But, there’s work to do because ..
Comparative strength outside London & the South East is by no means broadly based.

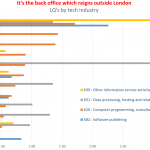
The chart shows a number of things that point to general cluster weakness outside the South of the UK. Remember that cluster strength is created by the presence of mutually supporting related industries.
It’s relevant therefore that in some places (and in particular Newcastle / Gateshead), there are tech industries with numbers so small that ONS doesn’t register them. In this cluster sense, Manchester is stronger than Newcastle / Gateshead.
Outside London & the South East, strengths are essentially in back office functions. The end use functions are largely absent.
That is a real problem for tech clusters to the North and West. So if your area’s strength is in computer games, then you need companies to publish them as well as develop them – and so on. (With apologies if that’s not the way the games industry works). All of this is a pointer to what areas need to do to strengthen their tech even more. We’ve seen real change; the North need more.

Get notified when new content is added
Join our mailing list to receive notifications when new content is published
You have Successfully Subscribed!