A resident of West Bridgford in Nottingham (who happens also to be a non-executive director of our company) sent us a message with a link. His message (about crime data) was “Seen this? Is it good?”.
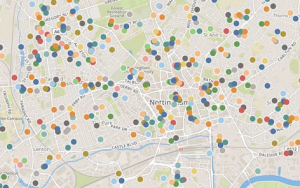
 This is what he referred to; it’s an initiative in Nottinghamshire which enables people (as the headline says) to “view every crime reported in Nottinghamshire on an interactive map”.
However, it’s not very useful – and here’s why.
Public data is different
Public data isn’t customer data. A customer knows what she wants from her data (although she may perhaps struggle to articulate it and that’s where the expert comes in) but public data is different. The reason that the state develops a dataset is not necessarily one that resonates with the general public. And very often the State releases data with an ‘open data’ rationale without thinking through how a user might get value from it.
Crime data has been available in the UK for close to a decade. Every so often – as in the week of 16th July – crime makes significant headlines. But the Police UK crime data (it’s released every month) rarely makes the national headlines. It rarely makes the local headlines either – which is surprising because this is really local data.
So West Bridgeford Wire is to be applauded for having a go. But ….
Points on a map are not a good idea.
Police UK release crime data with a latitude / longitude attached to each crime. However, although this is precise, Police UK also say it’s not where the crime occured. So showing crimes as points on a map conveys a location precision which is wrong – and therefore profoundly misleading. The actual crime might not be far away from you – if you live in a city – but it could be some distance away if you don’t. The only thing you can be sure of, is that it’s NOT where the point on the map shows it to have been.
Points on a map tell only a minor story
Let’s put ourselves in the position of Joe Public – what does he want from crime data? Joe wants to know:
- How bad is crime round here?
- Is it getting better or worse?
- What kind of crime am I likely to suffer around here – and is THAT getting better or worse?
Point data for one month answers none of these questions.
Question 1 (how bad is it around here?) requires comparison places or perhaps comparison with the country. Comparison with somewhere.
Question 2 (is it getting better or worse?) requires historical data and a trend line.
Question 3 (what kind of crime … ) requires an ability to drill into the crime data.
Crime data is a big database
Answering these questions requires access to a very big database. As the West Bridgford Wire points out, there were 12,000 crimes in Nottinghamshire in one month. Multiply this many fold to answer question 2 (is crime getting worse?) and many fold again so that a user can select any comparison place he likes (for question 1).
Just exactly how big is this? In our database, it’s 62,372,660 records.
And here’s the rub …
The size of the crime database is not at all unusual in the public data realm. Because public data is often about ‘us’, the residents of the UK, it’s genuinely ‘Big Data’. There’s a temptation to use freely available software to offer ‘something’ to the public. However, there are usually limitations on that free software – and in the case we’re discussing here, it’s around one quarter of the records required to answer the questions above.
But there is a way
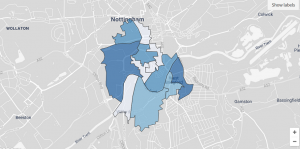
Gavurin Lite does enable these questions** to be answered – and it is publicly available. Click here to see the interactive version of our Nottingham map (the one in this blog) in Gavurin Lite. Gavurin Lite will open precisely at the Nottingham map in this blog. Once you’re into the dashboard, scroll down and you’ll see the trend in these places over nearly 8 years and the crime types in the latest month.
And while you’re there, check out the crime stats for your own area – and the latest house prices, and the latest stats on the population.
** Well mostly. Gavurin Lite won’t enable you to drill into a particular crime and identify the trend with THAT crime. For that analysis you’d need Gavurin Analytics. Please get in touch if you’d like to talk about that – or indeed anything else.


Get notified when new content is added
Join our mailing list to receive notifications when new content is published
You have Successfully Subscribed!